

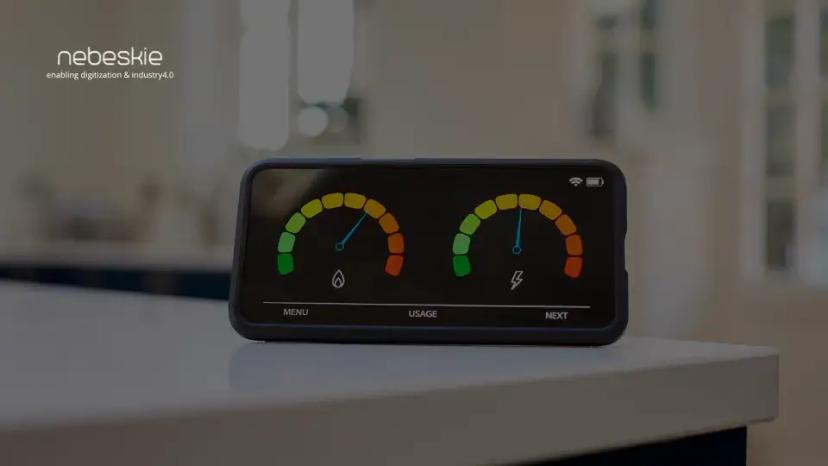
Energy Monitoring is primarily a management technique
Energy Monitoring is primarily a management technique that enables industries to control energy consumption accurately.

Energy monitoring and targeting(M&T) is an approach in energy management to eliminate waste, reduce current level of energy use and optimize existing operation efficiency. This is based on the simple management principle “You can’t manage what you can’t measure” . M&T is an activity, which uses information on energy consumption as a basis of control and management of energy use. This activity is a part of broader energy management activity.
The main phases of M&T are described in figure below:

Energy modeling is mainly divided in two categories. The first one is called forward energy modeling, which consists in the generation of a computer-based simulation of the facility. Forward models are centered in assuming most of the variables to determine the cooling and heating load of the building. This is done by simulating the thermal performance of the facility and estimating the electricity and gas consumption to find its total energy use. The second method is called inverse energy modeling, which is based on the development of a mathematical equation (usually resulting from a regression type of analysis), that relates the energy use with the buildings energy drivers (weather, occupant activity and/or production or a combination of these). Inverse modeling uses the actual energy consumption (electricity or gas) along time rather than the heat interactions to model the building
- The Cumulative Sum of Residuals (CUSUM) algorithm is one of the first methods suggested for statistically detecting changes in engineered processes. It is the most commonly suggested statistical aid for measuring and verifying (M&V) energy saving and for performing M&T.
- A CUSUM chart represents the difference between the baseline or the best-fit line (Expected or standard consumption from regression model) and the actual consumption points relative to the same time period of the base line.
- There are two types of CUSUM charts. The parametric form and the recurrent form. The parametric form relies on the linear regression to predict energy consumption or the best-fit line.
- Typical CUSUM graph will follow trends and indicates the random fluctuation of energy consumption that oscillates around standard or expected consumption. This will continue until something occurs to alter the pattern of consumption as a result of an energy saving measure or increase in energy usage due to fault.

The final part of the analysis in M&T is the creation of energy consumption targets based on the performance observed in the CUSUM chart. It will set a target or threshold cap, within which the energy consumption can fluctuate without showing an alert. These targets are based on the actual performance of the industry energy consumption, they will show its best realistic possible behaviour.

How OEE Software Can Be Customized for Different Types of Manufacturing Equipment
Customizing OEE software for various manufacturing equipment involves tailoring its features, integrations, and data processing capabilities to suit the unique requirements of specific equipment types and manufacturing processes...
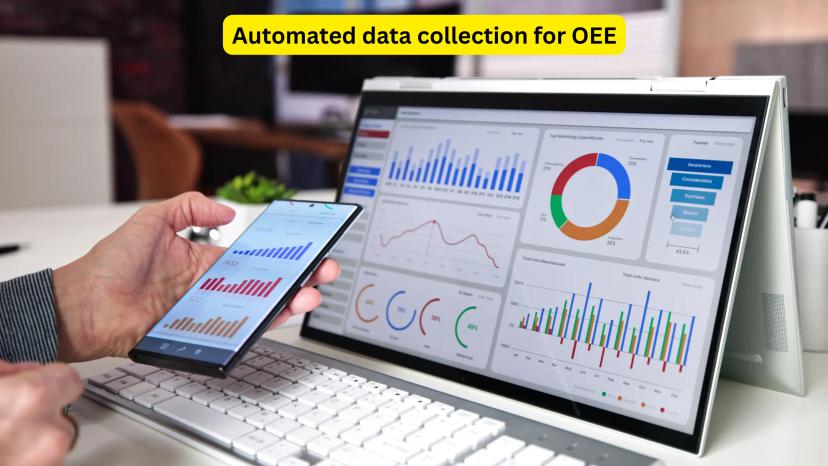
How can OEE software automate data collection from different machines
OEE software automates data collection from different machines by leveraging advanced technologies and standardized protocols to ensure seamless and accurate data acquisition...

How OEE Differs Across Various Industries
Overall Equipment Effectiveness (OEE) is a versatile metric, but its application and benchmarks vary significantly across industries due to differences in operational processes, equipment types, and industry-specific challenges...

Common Challenges in Implementing OEE Metrics
Implementing Overall Equipment Effectiveness (OEE) metrics can be transformative for manufacturing efficiency, but it comes with several challenges...
How can OEE be used to improve manufacturing efficiency
Overall Equipment Effectiveness (OEE) can significantly improve manufacturing efficiency by identifying inefficiencies, reducing waste, and optimizing production processes...
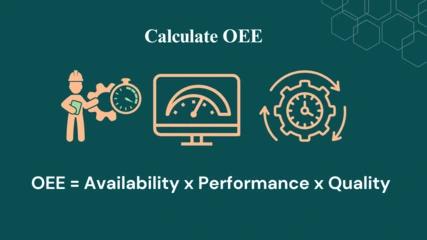
Overall Equipment Effectiveness (OEE)
Overall Equipment Effectiveness (OEE) is a standard metric used to evaluate the efficiency and productivity...
Challenges of Ageing OnPremise Energy Monitoring Systems
Energy management has become more critical in today's fast-paced industrial and commercial environments...
Unlocking Predictive Maintenance A Deep Dive into Energy Usage Analysis
In today's fast-paced world, where energy consumption directly correlates with operational efficiency...
Cybersecurity in Digitized Factories: Protecting the Future of Manufacturing
As factories worldwide embrace digital transformation, they become increasingly connected and automated...
Energy Monitoring & Savings: Harnessing Insights
In an era where sustainability has become a keystone for responsible living and environmental stewardship...
Maximizing Building Efficiency: Navigating the Essentials of EPI
Energy efficiency is crucial in today's built environment, not just for cost savings but also for environmental sustainability...
The High Cost of Manual Monitoring: Manufacturers Need Real-Time Data Solutions
In today's rapidly advancing world, 99% of factories and large commercial buildings ...

Industry 4.0: The Technological Ally in Achieving Net Zero Goals
The industrial sector is a significant contributor to worldwide greenhouse gas (GHG) emissions...
Leveraging IIoT for Enhanced Sustainability Metrics in Manufacturing
Sustainability has become a vital part of the contemporary manufacturing industry. The Industrial Internet of Things (IIoT)...
Navigating the Path to Net Zero: Harnessing Digitization for Sustainable Transformation
As the world grapples with the urgency of climate change, the concept of achieving net zero emissions...
Harnessing the Power of IIoT and Digitization in Shaping Future Organization Strategies
The Industrial Internet of Things (IIoT) is revolutionizing how businesses operate, offering unprecedented...
Carbon Border Adjustment Mechanism (CBAM)
The Carbon Border Adjustment Mechanism aims to mitigate carbon leakage by imposing a carbon price on ...
PAT Scheme
The National Mission for Enhanced Energy Efficiency (NMEEE) is one of the eight missions under the National ...

IIoT for MSME
In the era of Industry 4.0, technological advancements are transforming the way businesses operate...
HVAC Monitoring
In today's world, where we are more and more aware of energy usage, the way we manage our HVAC (Heating, Ventilation, and Air Conditioning) ...
Sustainability Certifications and Digitization
India is aiming to be Net Zero by 2070, Government of India has a huge push towards “Green Growth” by providing a budget of INR 35,000 cr...

ESG Reporting
Environmental, Social and Governance or ESG, are a set of data and principles used to evaluate how an organization’s behavior is impacting society and the environment, and the standards to which it is governed...

Indoor Air Quality
On average, a person spends 90,000 hours at work over a lifetime, roughly 10.2 years. And in the hustle and bustle of work, it's easy to take the air we breathe in our indoor spaces' comfort for granted...
VFD Monitoring
Variable Frequency Drive (VFD) monitoring is a crucial aspect of industrial and commercial where electric motors are widely used. VFDs devices control the speed & torque of electric motors by varying the frequency and voltage...

Securing the Digital Landscape of Industry 4.0
The world has been rapidly shifting towards digitalization & automation with the advent of Industry 4.0.
Roadmap for Factory & Building Digitization
For factory and building digitization, outlining the essential steps to successfully implement Industrial Internet of Things (IIoT) solutions for energy management, data-driven maintenance strategies, and overall efficiency...
Digital transformation in manufacturing
Digital transformation in manufacturing is the process of integrating digital technologies into all areas of a manufacturing company’s operations and processes to drive more efficient production, reduce costs
Unleashing the Power of Industry 4.0, IoT, and Digitization
By leveraging cutting-edge technologies, optimize power quality, enhance energy efficiency, streamline management tasks, drive strategic decision-making...

The OT and IT Integeration - Industry 4.0
IIoT enables monitoring of OTs and machinery through the OTs. IIoT. Once the operation, energy, and production data are available, predictive maintenance are implemented to drive efficiency...
Digitization, Industry4.0 and Predictive Maintenance
IIoT-based predictive maintenance utilizes historical data to make accurate predictions about asset health, utilization, performance, enabling organizations to take action based on this information and data...

How to implement digitization project successfully?
Digitization is an opportunity to transform your operations to solve your top challenges and meet your business goals; it is not just about upgrading production technology to reduce downtime risks...

OEE for Pharma Industry
India has the highest number of US-FDA compliant Pharma plants outside of the USA and is home to more than 3,000 pharma companies with a strong network of over 10,500 manufacturing facilities...
Big bill for bill chill
With better access to data, one can clearly see when their chillers are costing them the most to operate. As well as seeing what is happening, access to data allows the owners of chiller units to detect potential faults...
HVAC Monitoring for Systems Integerators Contractors and Domain Experts
Using the IoT to monitor and record HVAC systems helps manufacturers, contractors, system integrators, domain experts, and end-users improve energy efficiency...
Edge Computing - An essential pillar for Industry 4.0
Edge Computing serves as the bridge to connect the operation technology & the information technology. Top reasons why deploying edge computing is essential for I4.0 or digitization...
Tips to implement Digitization
The main objective of digitizing factories is to enhance operational visibility with all stakeholders, optimize resource efficiency and productivity, and, ultimately, build better quality products with less cost...

IIoT/I4.0 and Security: Why should you focus on Security?
With the evolution of The Industrial Internet of Things (IIoT) or I4.0, manufacturers will have networks of connected industrial devices working together to monitor...

Importance Of Measuring Power Quality
Power quality monitoring is similar to energy monitoring in which they measure voltage and current. There are much higher processing and computational requirements in order to detect, capture, and measure power quality...
Energy Monitoring is primarily a management technique
Energy monitoring and targeting is an approach in energy management to eliminate waste, reduce current level of energy use and optimize existing operation efficiency...
Industry 4.0 for Small and Medium Enterprise (SMEs)
In a highly competitive market, the greatest challenge for all MSMEs is to address the needs of the end customer, while keeping costs down...

IoT and Predictive Maintenance - Make Your Buildings Energy Efficient
IoT enabled predictive maintenance strategies apart from preventing unexpected equipment failures can also improve the energy efficiency.
Industry 4.0 & Digitization for efficiency
Digitization transforms business processes to drive profitability and efficiency. It ensures higher efficiency, lower operating costs, and better control of business operations for the companies...
Dont Ignore Benchmarking
Energy monitoring has become one of the prime focus areas for almost all facilities across various sectors these days; implementing few energy-saving projects, realises the cost savings...

What are sustainable development goals and why it is important for humanity and mother earth?
According to the UN, The Sustainable Development Goals (SDGs) are the world’s shared plan to end severe poverty, reduce inequality, and protect the planet by 2030...

SCADA and IoT EMS
SCADA is an automation software & works with a short span of dense data for reliable operation. It consists of programmable control logic & is designed to achieve very advance...
ROI for Smart Energy Monitoring Systems
For any energy-saving project to go through, ROI is the key, the same applies to deploying smart energy management systems; ROI depends on a smarter way of configuring...
Industry 4.0 and How to implement it
Implementing Industry 4.0 into MSMEs can directly result in increased competitiveness with much bigger firms, improved productivity, better operational IT, cost reduction...

Energy Monitoring and Targeting
Energy Monitoring & Targeting(EM&T) is essential for industries & commercial buildings. It's globally proven energy monitoring alone leads to a significant amount of savings...
IoT Energy Management
Energy management is the process to plan & manage energy consumption in buildings. Monitoring energy data across the whole organization at a regular interval is a daunting task...
Specific Energy Consumption Report and Energy Monitoring Benefits
Energy Management System enables your facility and finance teams to identify excess energy use and empowers them to resolve the issue and save money...

Steps to revive MSMEs in the current times and build a turbulence-proof business (using DIP Strategy)
The main objective of digitizing factories is to enhance operational visibility with all stakeholders, optimize resource efficiency, productivity build with less cost...

How is NEBESKIE LABS redefining the Electricity Management & helping reduce electricity wastage for businesses in India?
The world is moving ahead with a vision to build sustainable cities of the future using advanced technologies...